
Chart Echo
Chart Echo searches millions of historical stock and crypto charts to find patterns matching your current setup and shows how they played out.
Visit
About Chart Echo
Chart Echo is a historical pattern matching tool designed for traders and investors who want to base their decisions on precedent rather than intuition. The platform searches approximately 450 million historical windows across stocks and crypto to find chart patterns that closely resemble the one you are currently analyzing. Once matches are found, Chart Echo overlays those historical patterns on your current chart in gold and shows you exactly how those patterns continued after the match point. This provides a data-grounded picture of the odds, including how often similar setups rose, fell, or went nowhere, the average move, and the typical drawdown along the way. The tool is built for active traders, long-term investors, and crypto watchers who want to sanity-check breakouts, sell-offs, or any chart formation against decades of real market history. Chart Echo is not a prediction engine and does not offer financial advice. Instead, it organizes the market's own memory so you can study precedent in seconds instead of scrolling through years of charts manually. The platform offers a guided five-step flow that takes you from selecting a market to viewing matches, overlaying echoes, and finally acting on the information by saving workspaces, setting reminders, or sharing results. Chart Echo is free to start with no account required, and accounts unlock additional features like saved workspaces and premium tools.
Features of Chart Echo
Massive Historical Database
Chart Echo searches through roughly 450 million historical windows across stocks and crypto to find patterns that match your current chart. This extensive database ensures that you are comparing your setup against a wide range of market conditions, timeframes, and asset classes. The sheer volume of historical data increases the likelihood of finding meaningful analogs, giving you a robust statistical foundation for understanding how similar patterns have resolved in the past.
Pattern Overlay and Outcome Statistics
Once historical matches are identified, Chart Echo overlays each match in gold directly onto your current chart. This visual comparison makes it easy to see exactly how the past pattern aligns with your setup. Beyond the overlay, the platform provides detailed outcome statistics for each match, including the average subsequent move, the typical drawdown, and the probability of rising, falling, or moving sideways. This transforms raw historical data into actionable insights.
Guided Five-Step Workflow
Chart Echo offers a structured, guided workflow that walks you through the entire analysis process in five clear steps: Market selection, Frame setup, Match review, Echo overlay, and Action. This eliminates the guesswork and blank canvas approach common in other analysis tools. Whether you are a beginner or an experienced trader, the guided flow ensures you consistently follow a proven methodology for studying historical precedent.
Multi-Platform Accessibility
Chart Echo is available both as a web application and a dedicated mobile experience. The mobile app provides the same guided flow for checking setups away from the desk, making it convenient for traders and investors who need to analyze charts on the go. The platform supports both stocks and crypto, covering a broad range of markets in a single unified interface.
Use Cases of Chart Echo
Pre-Trade Setup Validation
Before taking a trade, active traders can use Chart Echo to see the closest historical analogs to their current setup. By reviewing how those analogs resolved over the following days and weeks, traders gain a clear picture of the odds, average move, and typical drawdown. This allows them to enter trades with a data-driven understanding of potential outcomes rather than relying solely on gut feeling or technical indicators.
Long-Term Investment Sanity Check
Long-term investors can use Chart Echo to sanity-check a breakout or a sell-off against decades of historical precedent. Instead of relying on a single analyst's opinion or a news headline, investors can see how similar chart formations played out across different market cycles. This helps frame investment decisions within the context of the market's own history, reducing emotional bias and improving decision quality.
Crypto Pattern Recognition
Crypto markets are known for their repetitive and volatile patterns. Chart Echo allows crypto watchers to match Bitcoin, Ethereum, and other major cryptocurrencies against their own past structures and across different assets. This is particularly useful for identifying potential breakout points, capitulation lows, and blow-off tops by seeing how similar patterns resolved in previous cycles.
Educational Study of Market Behavior
Traders and students of market behavior can use Chart Echo to study how specific chart patterns have historically performed. By searching for patterns across different timeframes and assets, users can build a deeper understanding of market dynamics and pattern reliability. This educational use case helps develop pattern recognition skills and a more nuanced appreciation for the probabilistic nature of technical analysis.
Frequently Asked Questions
How does Chart Echo find matching historical patterns?
Chart Echo uses a proprietary fractal matching algorithm that analyzes the shape of your current chart and searches across approximately 450 million historical windows in stocks and crypto. The algorithm identifies windows where the price action closely resembles your current pattern, ranking them by similarity strength. It then shows you those matches overlaid on your chart along with their subsequent performance.
Is Chart Echo a prediction tool or financial advice?
No. Chart Echo is explicitly not a prediction engine and does not provide financial advice. It is a historical pattern matching tool that organizes the market's past behavior so you can study precedent. The platform shows you what happened after similar patterns in the past, but past performance does not guarantee future results. All analysis should be used as one input among many in your decision-making process.
Can I use Chart Echo for free, and what do I get with an account?
Yes, Chart Echo is free to start with no account required. You can immediately search for historical matches on any supported stock or crypto. Creating a free account unlocks the ability to save your workspaces for future reference. Premium accounts add Pro Mode, saved-setup reminders, intraday timeframes, alerts, and watermark-free exports for sharing analysis.
What markets and timeframes does Chart Echo support?
Chart Echo supports both stocks and cryptocurrencies. You can search across a wide range of popular assets and tickers. The platform allows you to set your own timeframe and define how many candles constitute your pattern. Free users have access to standard timeframes, while premium users unlock intraday timeframes for more granular analysis.
Pricing of Chart Echo
Chart Echo offers a tiered pricing structure. The platform is free to start with no account required, allowing you to search for historical matches immediately. Creating a free account unlocks saved workspaces. A Premium subscription is available for users who want additional features, including Pro Mode with advanced analysis tools, saved-setup reminders, intraday timeframes, real-time alerts for new pattern matches, and watermark-free exports for sharing GIFs and images. Specific pricing for the Premium tier is available on the Chart Echo pricing page.
Similar to Chart Echo

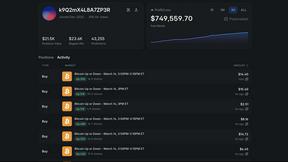
Polymarket Trading Bot For Crypto
An automated trading bot that executes a proven arbitrage and hedging strategy on Polymarket's 5-15 minute crypto markets using transparent.